Medieval summer temperatures shifted dramatically inside the last 2000 years, shows new studies. Next step is to map the shifts regionally
Instinct tells us that European climate has experienced substantial changes during the last decades, even though signs are different from place to place. While Southern Europe has been hit by heatwaves and extremely hot summers in 2003, 2010 and 2015, Northern Europe has experienced unusually wet and cold weather. New studies document that although general shifts may be detected, regional forms and variations of such climatic shifts inside Europe were the rule rather than the exemption.
Background:
One of the consequences of the need to scientifically come to grips with the present climatic upheavals has been a renewed interest in trying to get a real sense of the climatic conditions, which governed in the last two millenniums.
Presenting data covering the past 2000 years, one of these overviews has recently been published. These data provide a crucial perspective for characterizing natural decadal to centennial time-scale changes and to put recent climate change into a long-term perspective. Data sets consist of measures are three-ring width, maximum latewood density plus documentary historical reconstructions.
Working with a 31 years means, the result has been a model, which indicates that warm European summer conditions prevailed until the 3rd century, followed by generally cooler conditions from the 4th to the 7th centuries. Warm periods also occurred during the 9th – 12th centuries, peaking during the 10th century, and again in the late 12th and 13th centuries. he warmer medieval period was followed by relatively cold summer conditions, persisting into the 19th century, with a notable return to somewhat warmer conditions during the middle portion of the 16th century.
One important conclusion is that summers might occasionally be more anomalously warm in Europe in the medieval period than has hitherto been believed.
The warmest centuries were the 1st century and the 10th century. “Our primary findings indicate that the 1st and 10th centuries CE could have experienced European mean summer temperatures slightly but not statistically significantly (5% level) warmer than those of the 20th century,” writes the Luterbacher et al. who further notes that they find no evidence of any period in the last 2000 years as being as warm. According to the authors, such changes were reflections of external events like volcanic events and solar forcing.
Regional variations
However, the primary value of these studies for medieval historians is the conclusion that the collected data shows a marked spatial variability. For example, in the 11th century warm conditions seemed to reign in Northern Europe, while relatively cold conditions were experienced in South Western Europe. Different regions might thus undergo multi-decal periods of sustained temperature deviations at times when the rest of the continent would experience a less tumultuous climate. These phenomena are currently being explored by this group of scientists, producing gridded climatic maps, which might allow in-depth analysis of spatial co-variations.
This would be of real value for historians as such maps might shed light on the possible linkages between for instance regionally deteriorating climate, famines and sudden migrations.
SOURCE:
European Summer Temperatures since Roman Times
By J Luterbacher, J P Werner, J E Smerdon, L Fernández-Donado, F J González-Rouco, D Barriopedro, F C Ljungqvist, U Büntgen, E Zorita et al
In: Environmental Research Letters, Volume 11, Number 2
READ MORE:
The publication is presented by a group of scientists working under the umbrella of the global network, PAGES – Past Global Changes. All authors are part of the Euro-Med 2k Consortium under PAGES2k
PAGES (Past Global Changes) supports research which aims to understand the Earth’s past environment in order to obtain better predictions of future climate and environment, and inform strategies for sustainability. We encourage international and interdisciplinary collaborations and seek to promote the involvement of scientists from developing countries in the global paleo-community discourse. Pages was founded in 1991, and has 6000 subscribers and 27 working groups. Its results are published as open source.
The Euro-Med2k Working Group focuses on creating spatial reconstructions and modelling past climate in the Europe and the Mediterranean region (including southern Europe, the Middle East and northern Africa) over the last 2,000 years.
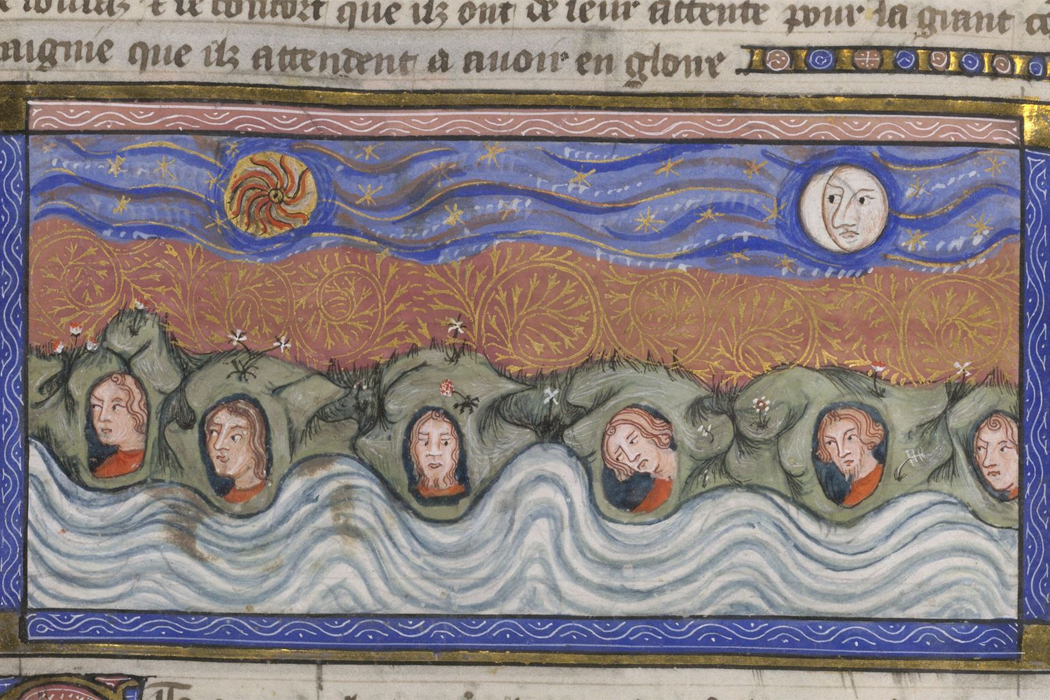
FEATURED PHOTO:
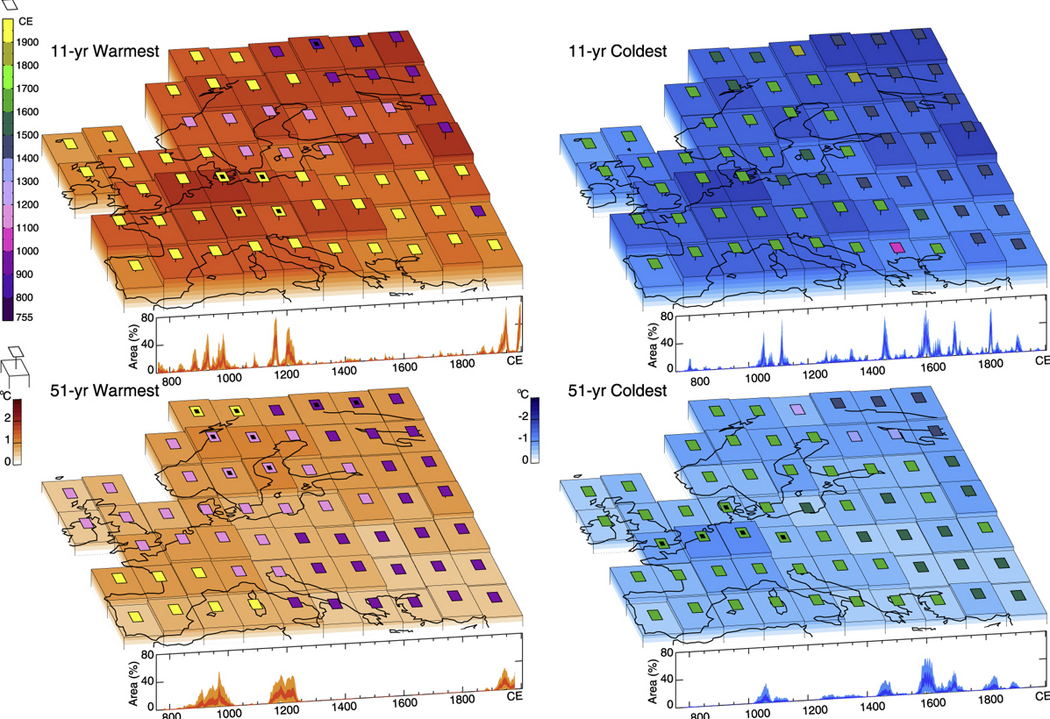
Hopefully, in the future we will see more of such maps showing the shifting climatic situations in different European Regions over time. The text to the figure is:
Top left: spatial distribution, magnitude and extension of the warmest 11 yr periods in European summer temperature. Grid cell height represents the ensemble mean temperature anomaly (in °C, with respect to 755–2003 CE) and the shading is incremented with a contour interval of +0.2 °C. The colour and the height of the squared symbols above each grid point identify the most likely date and the temperature uncertainty (+2SD level) of the warmest mean 11 yr period across the ensemble, respectively. Dots in squares denote those grid points with more than 75% of the ensemble members agreeing on the timing of the warmest 11 yr period (i.e. having their warmest 11 yr periods in the same 100 yr interval). The front panel of the map shows the ensemble-based temporal evolution of the fraction of European surface (in % of total analysed area) with 11 yr mean summer temperatures exceeding their +2 SD from the 755–2003 CE mean climatology. The light (dark) red shading indicates the 5th–95th percentile (±0.5SD) range of the ensemble distribution. Bottom left: as in the top left panel but for 51 yr mean periods. Right: as left panels, but for the 11 yr (top) and 51 yr (bottom) coldest periods. See SOM for details.